Below is a gallery of my favorite original graphics, maps, charts, and gifs. Many have appeared in my articles or research, while others were made just for fun.
I typically work in R/ggplot2 then touch up with Photoshop as needed.
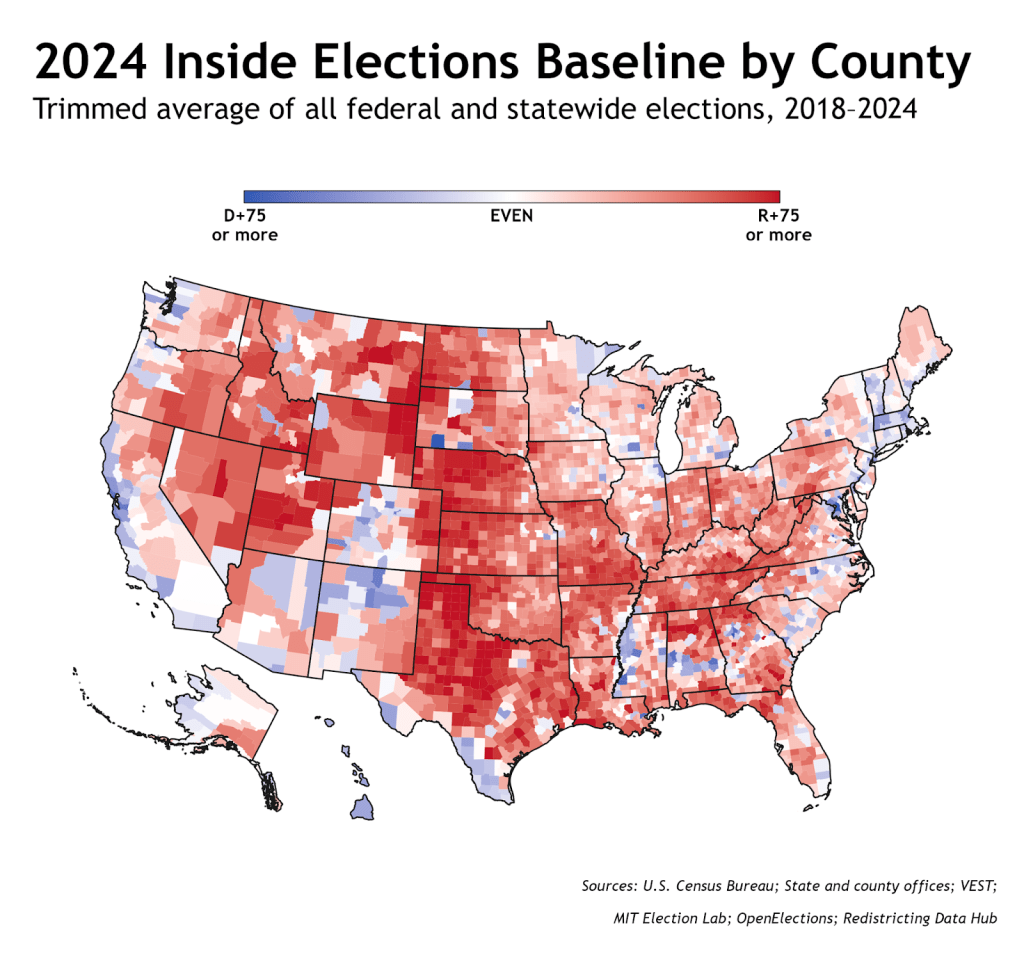
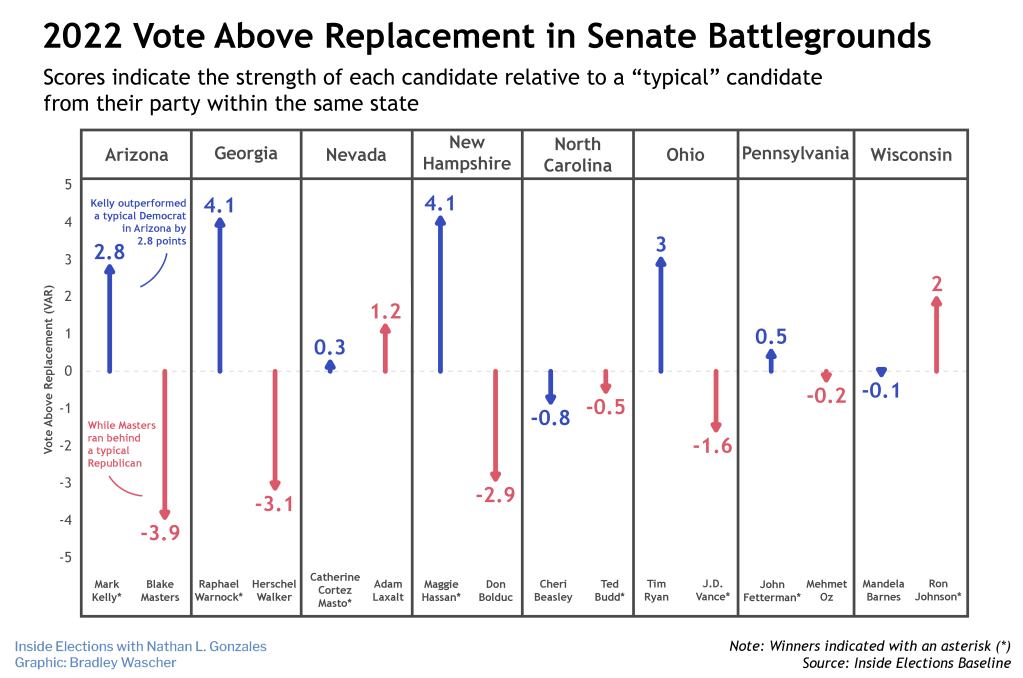
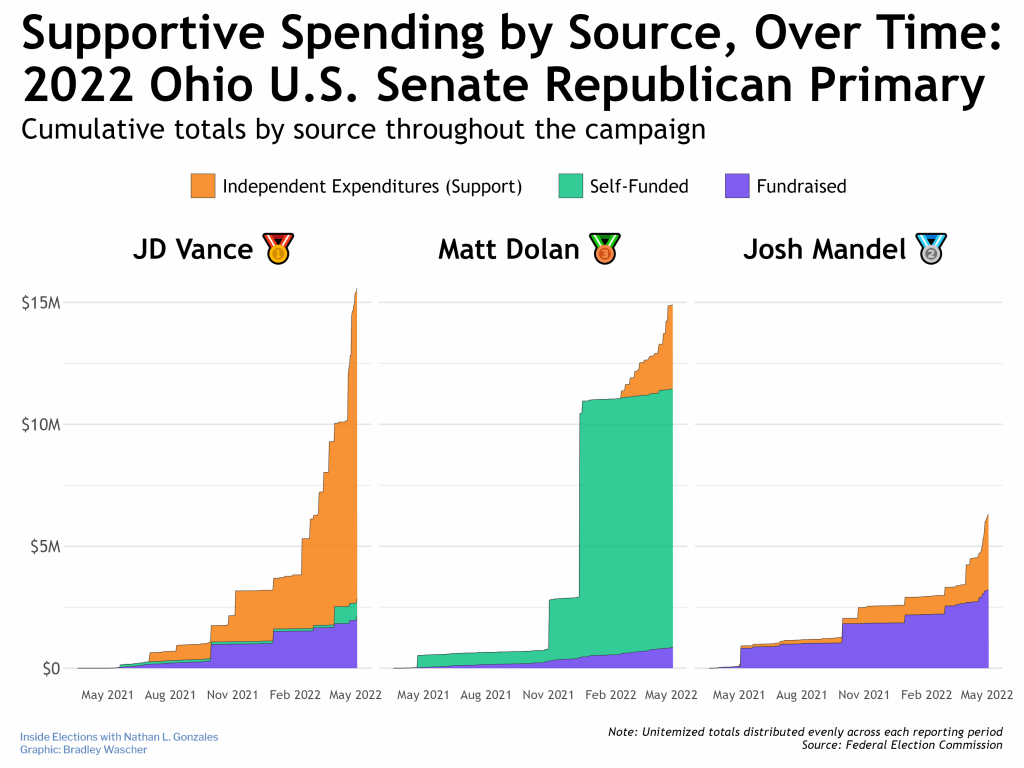
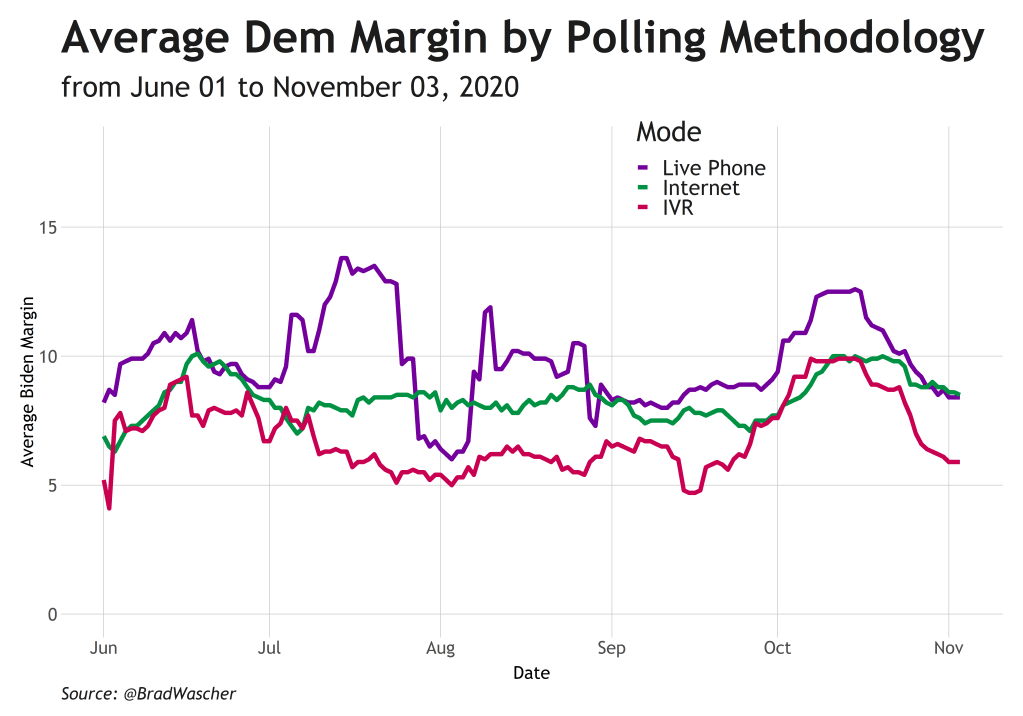
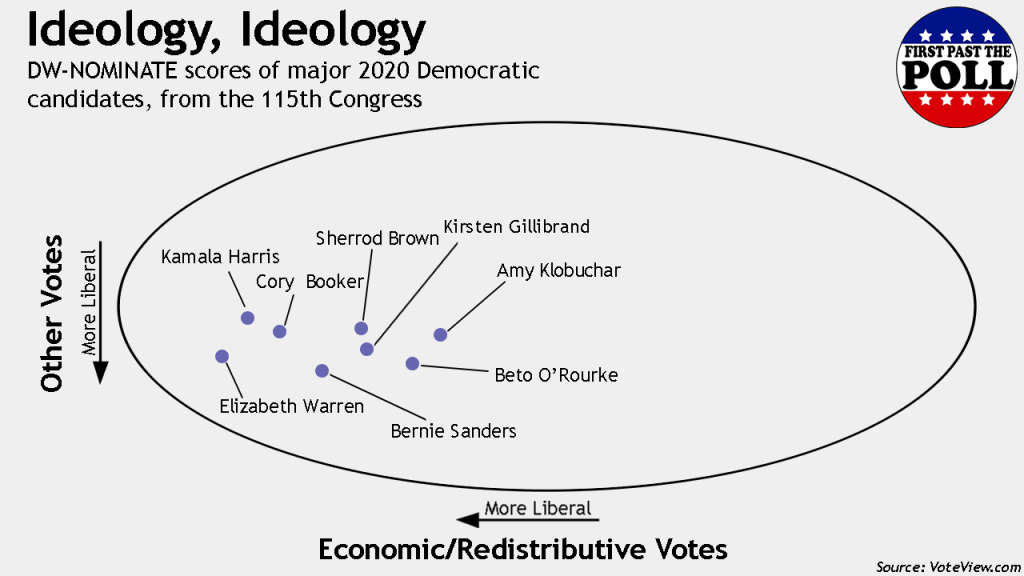
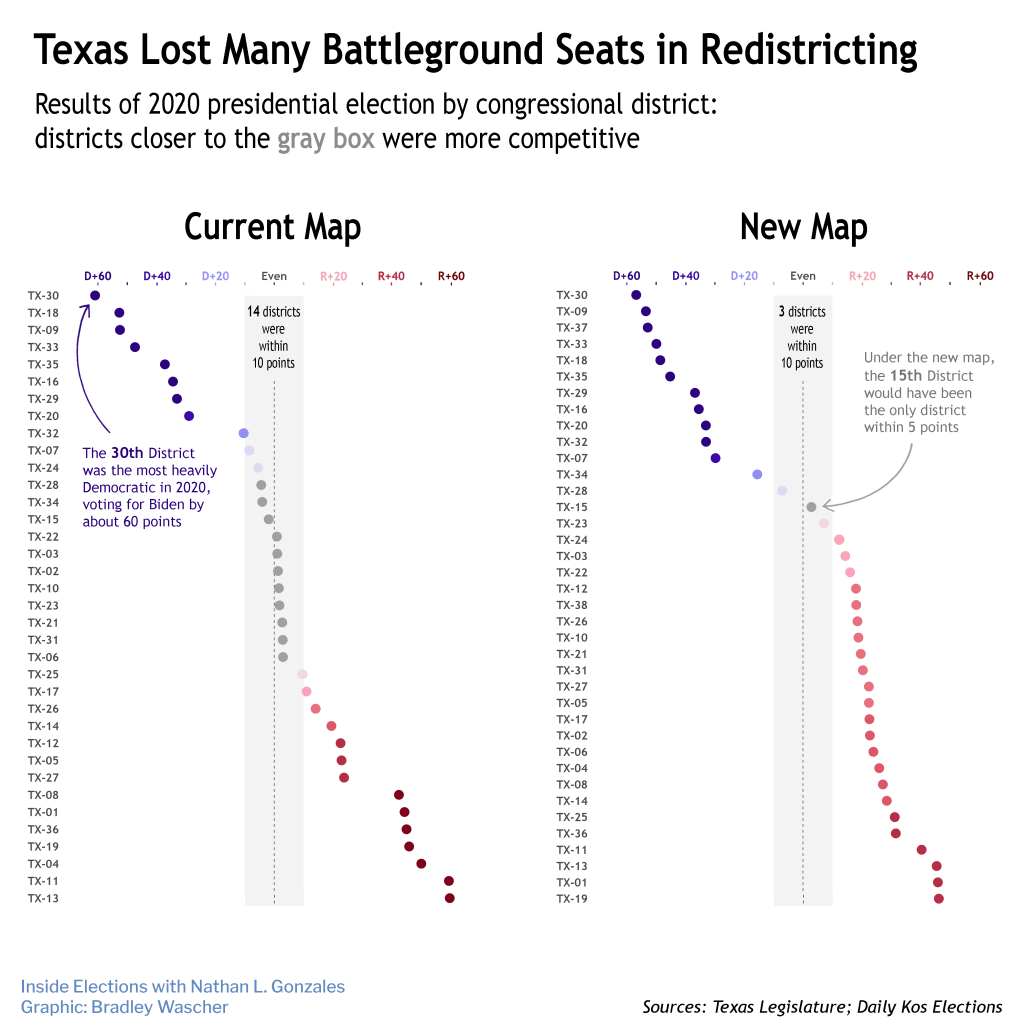
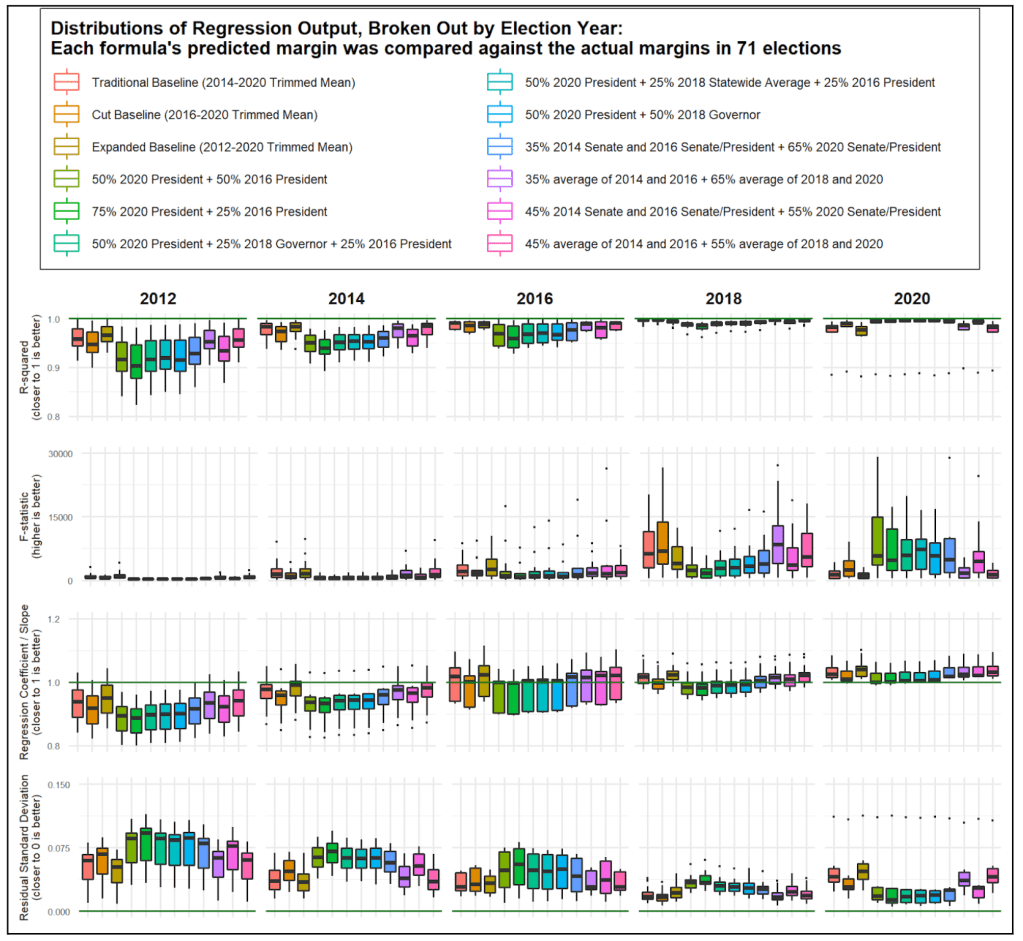
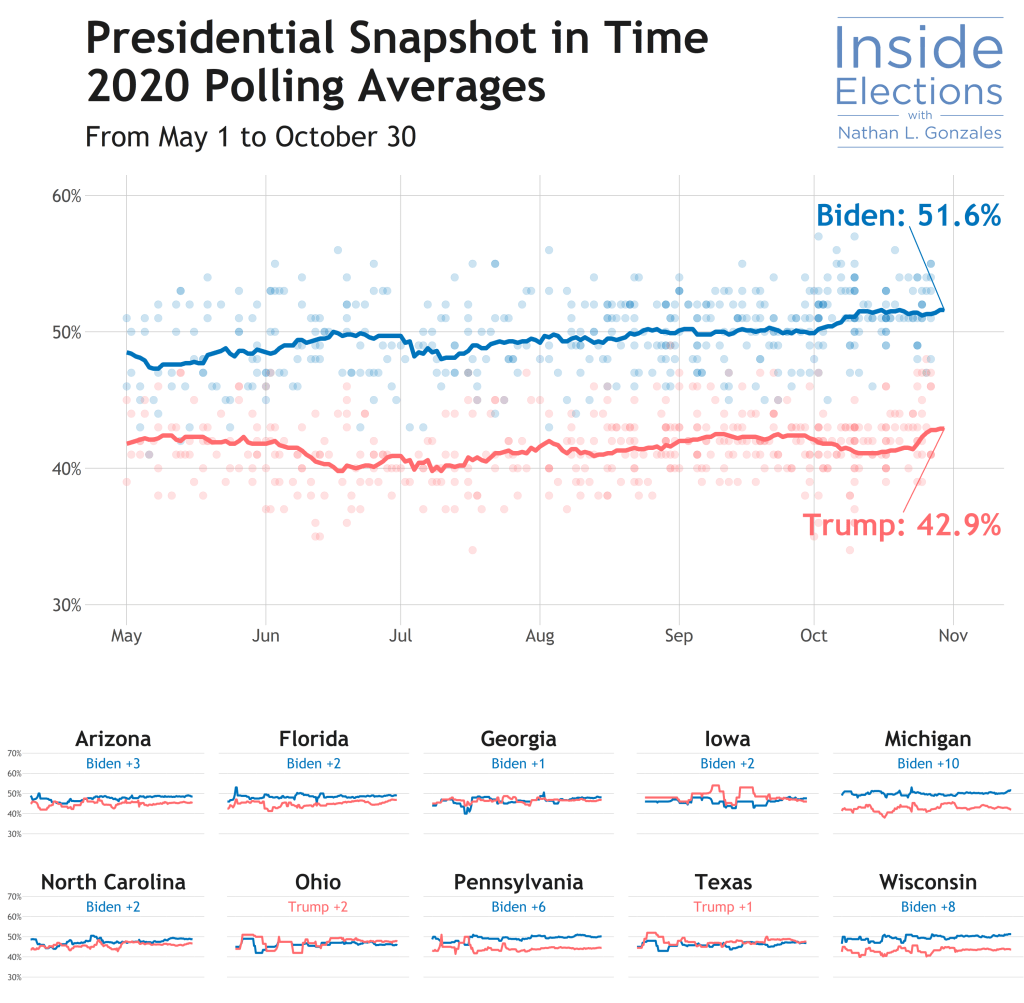
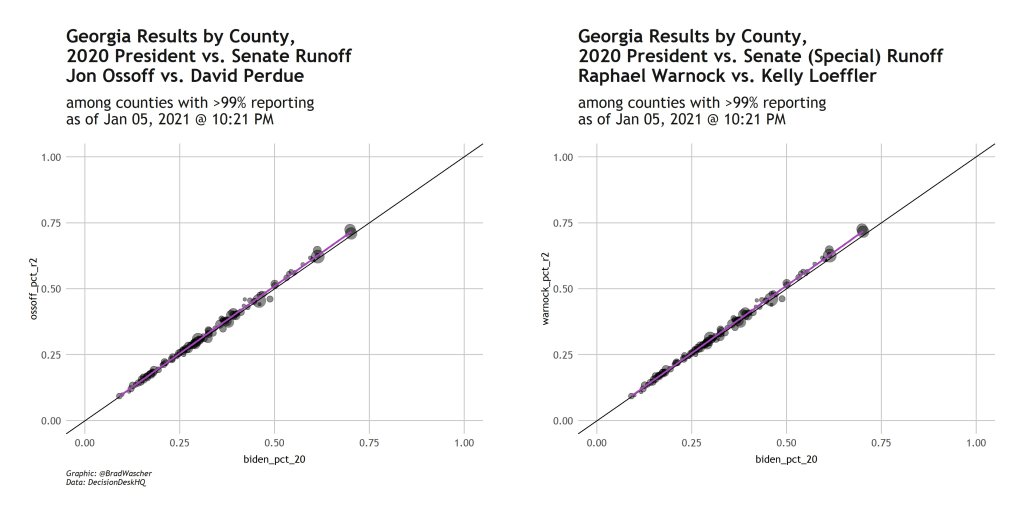
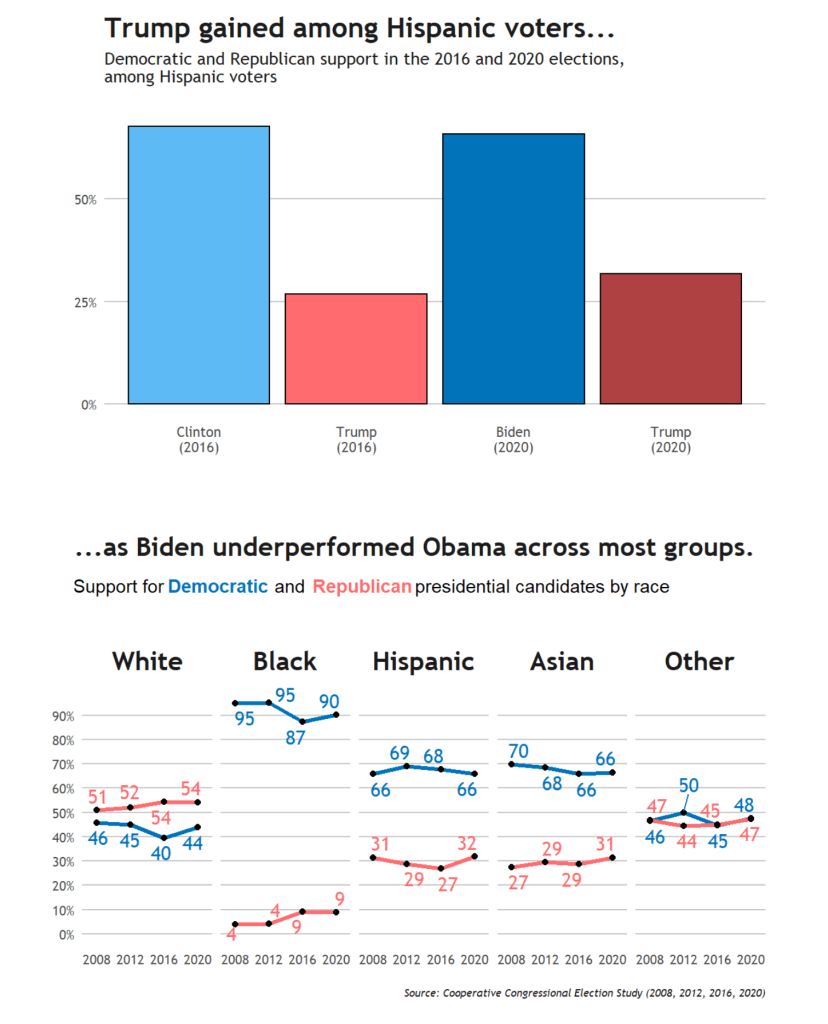
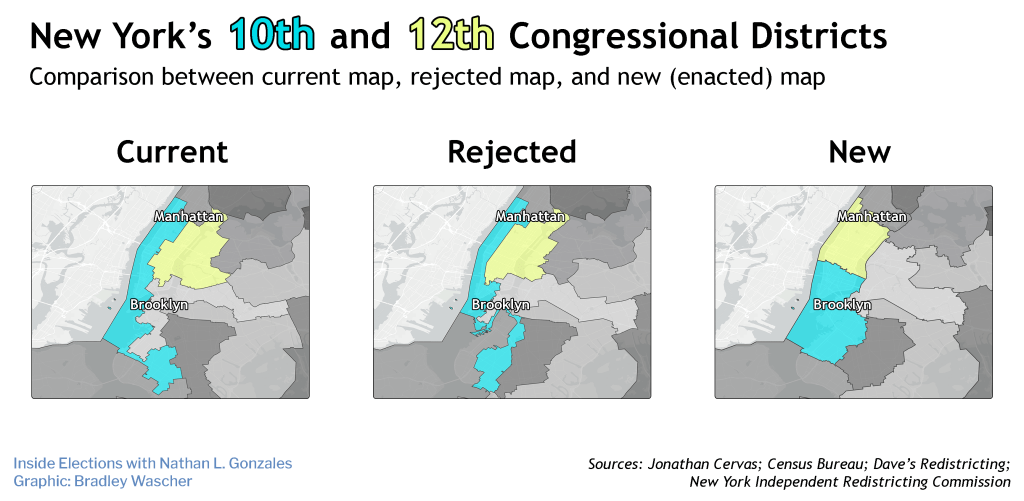
Choropleth map of 2024 Inside Elections Baseline scores for all 3,152 counties nationwide. Baseline is an average based on nearly 70,000 county-level breakdowns of every federal and statewide election in each state between 2018 and 2024. Article.Dumbbell plot comparing March approval rating, November approval rating, and share of the national popular vote for presidents seeking re-election. Article.Arrow plot of the Vote Above Replacement (VAR) scores for 2022 Senate candidates in major battlegrounds, measuring the strengths of those candidate relative to a typical candidate from their party within the same state. Article.Map comparing Florida’s congressional districts before and after redistricting. The redrawing of the heavily Black 5th District pushed Democratic Rep. Al Lawson out of Congress. Article.Table displaying election data by county in New Jersey, acting as a cheat sheet for following results on election night in the 2025 governor race. The novel contribution was county-level benchmarks for Democrat Mikie Sherrill and Republican Jack Ciattarelli. Article.Area plot showing cumulative campaign spending over time, broken down by funding source, for the top three candidates in the 2022 Ohio GOP Senate primary. Future Vice President JD Vance won with a narrow cash advantage thanks to $15 million in outside support from Peter Thiel — one example of a successful campaign donor “whale.” Article.Line graph comparing different polling methods in the 2020 presidential election. Biden held similar leads in polls conducted online and over live telephone, but performed a few points worse in polls administered using interactive voice response (IVR / robocalls). Tweet.Gif maps displaying simulated 2022 Senate outcomes under a range of hypothetical national margins. Article.Plot showing the DW-NOMINATE ideology scores of senators who were thought to be potential candidates in the 2020 Democratic primary.Blog post.Dot plot highlighting the steep decline in the number of competitive congressional seats in Texas following 2020 redistricting. Article.Qualitative color map showing the demographic characteristics of different Trump/Gallego precincts in Phoenix. Trump/Trump/Gallego precincts tended to be whiter and wealthier, with higher levels of college attainment, while Biden/Trump/Gallego precincts included Hispanic and working-class communities. Article.Box plot comparing the predictive performance of different combinations of election results between 2012 and 2020. This was made as part of an Inside Elections contract with Reasonable Districts Colorado following census reapportionment: I built these models to estimate each new congressional seat’s expected competitiveness before presenting in front of Colorado’s independent redistricting commission. Across the four metrics analyzed, Baseline formulas (the three leftmost boxes) were usually the strongest predictors of how a district would vote, Selected Races formulas (the seven middle boxes) were a bit less accurate but varied from formula to formula, and Grouped Years formulas (the two rightmost boxes) were consistently the weakest. Presentation and primer.Line graphs featuring the final set of national and state-level polling averages for Presidential Snapshot in Time, a six-month series of columns I wrote for Inside Elections. Article.Plots evaluating each candidate’s county-by-county benchmarks to win the 2021 Georgia Senate runoffs, suggesting wins for both Democrats. Published and updated live throughout election night. Tweet.Bar and line charts comparing the results of previous presidential elections by race, according to the Cooperative Congressional Election Study (CCES). This was a section of my final project for a data visualization class. Storyboard.Maps comparing New York City’s congressional districts before and after 2020 redistricting. The reconfiguration of the 10th and 12th districts set up a member-vs.-member Democratic primary in Upper Manhattan that pitted Reps. Jerry Nadler and Carolyn Maloney against each other; Nadler won. Article.
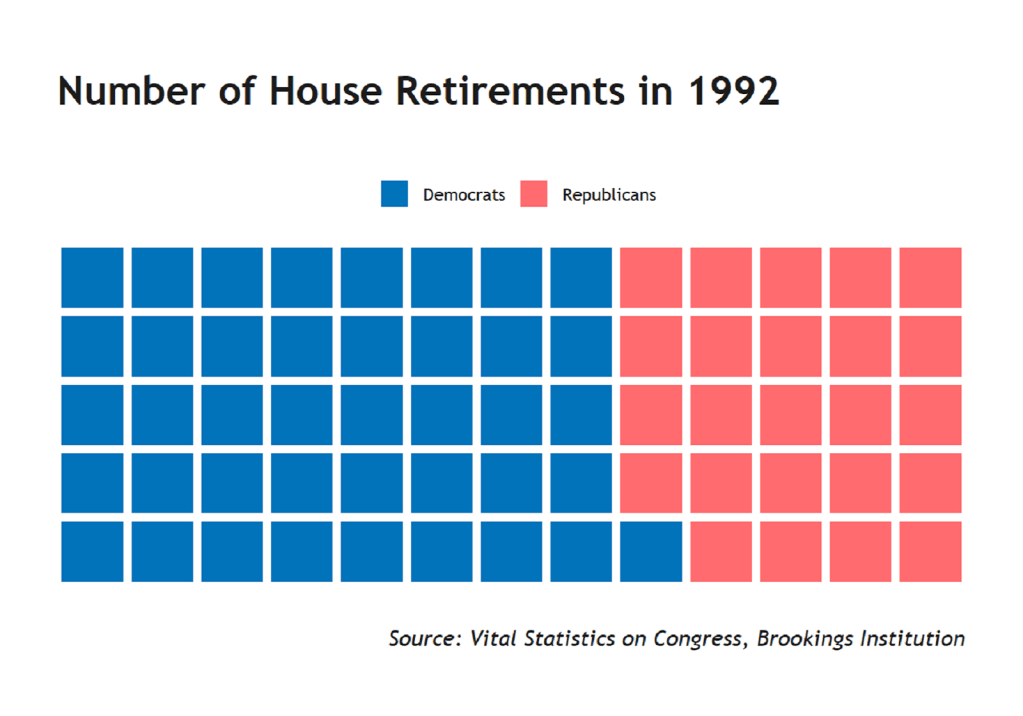
Waffle plot of U.S. House retirements by party ahead of the 1992 election. 40 Democrats and 24 Republicans retired, and Democrats would go on to lose nine seats in total.
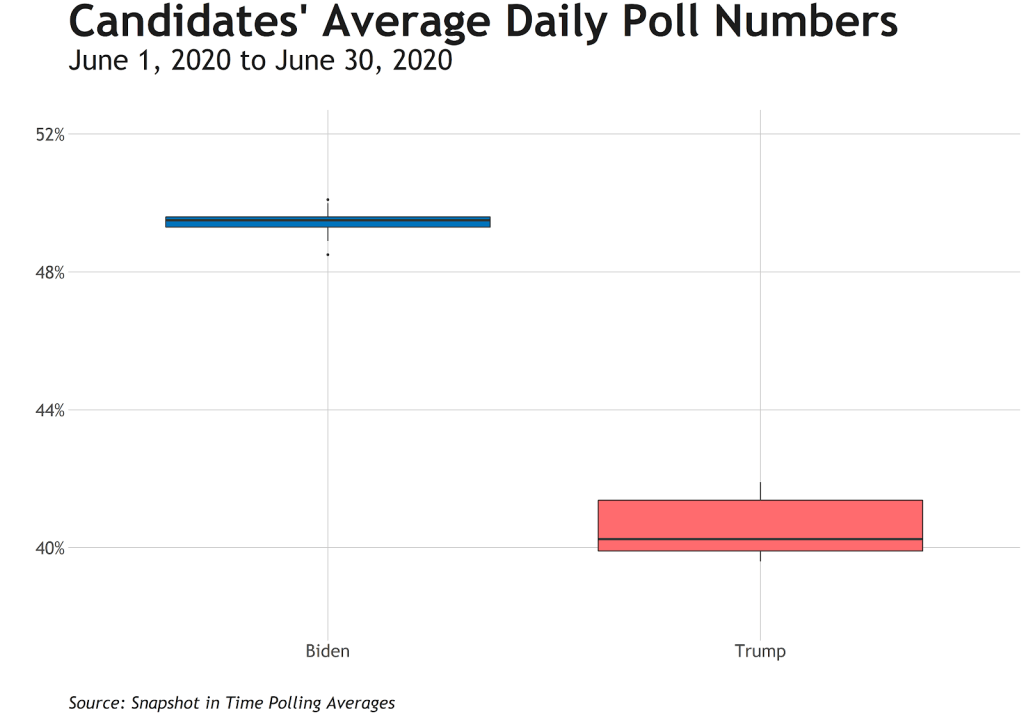
Box plot showing the stability of each presidential candidate’s polling numbers during June 2020. Joe Biden was much more stable. Article.
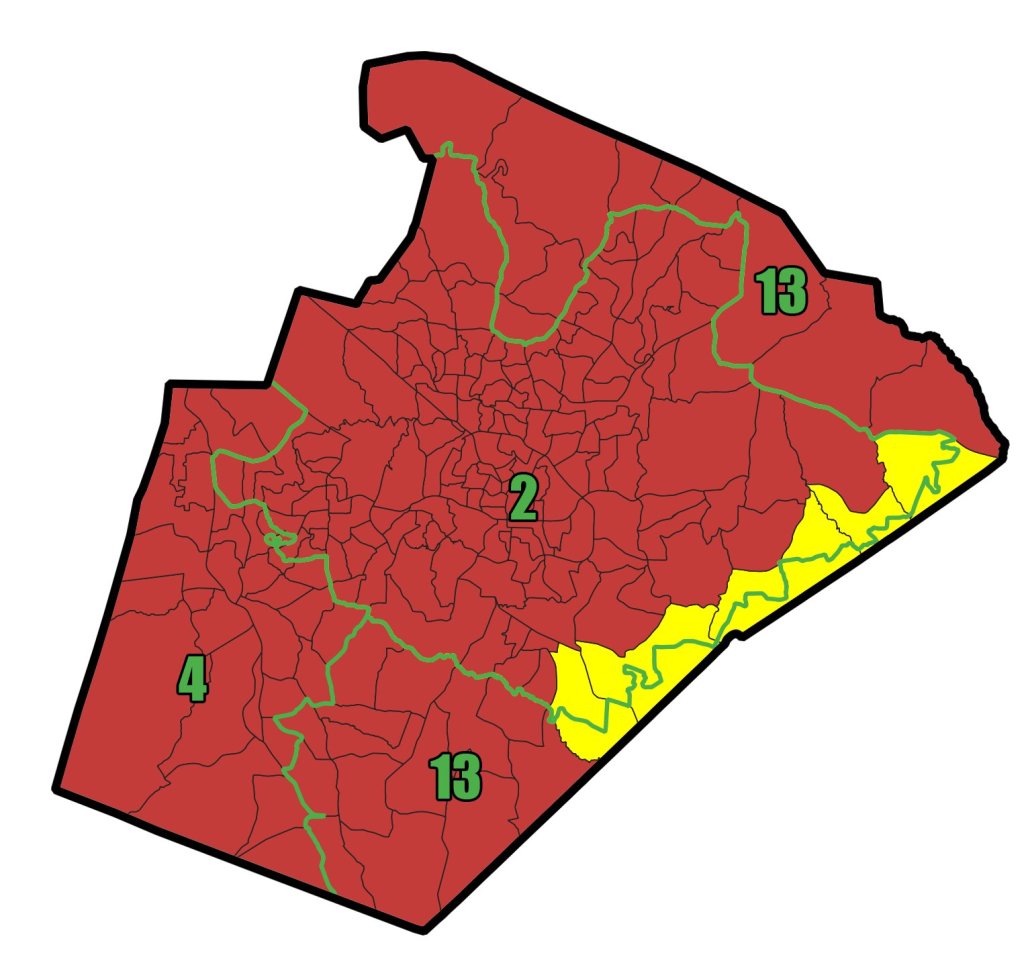
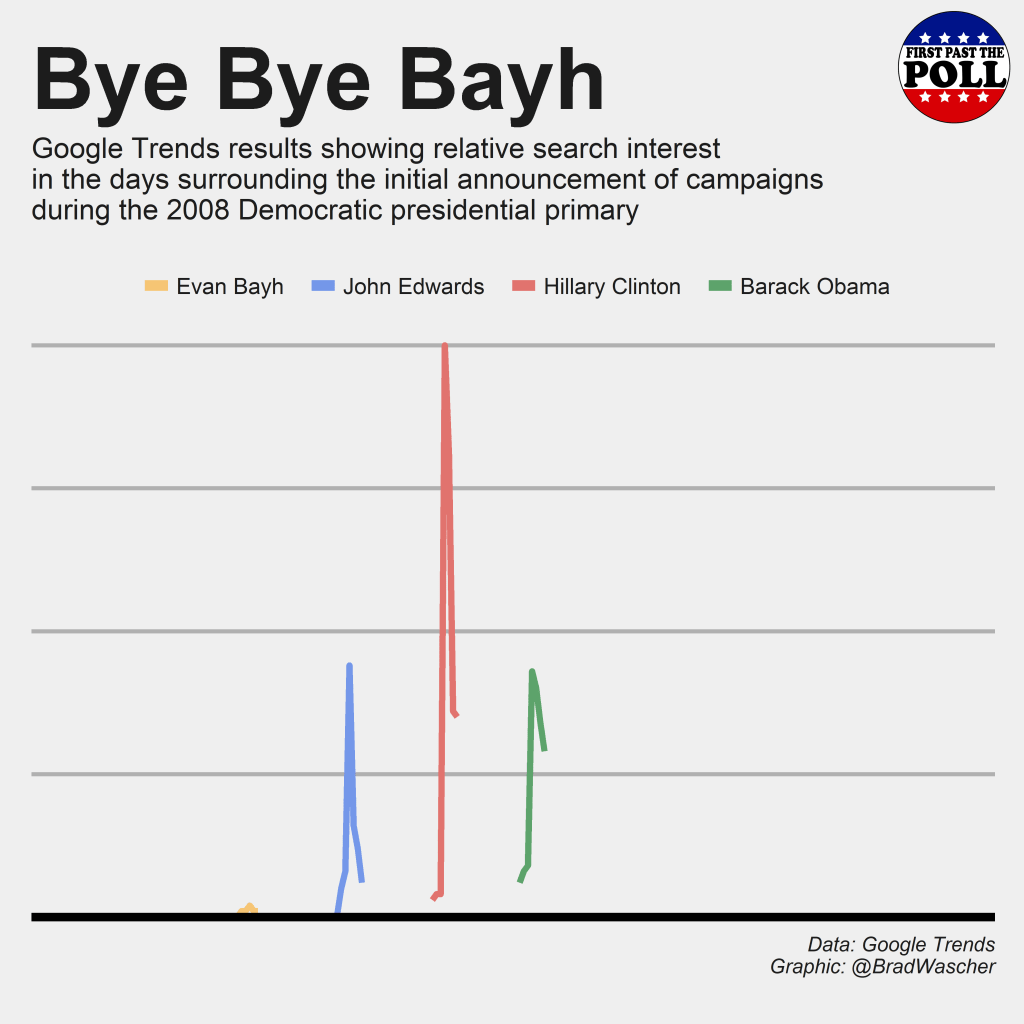
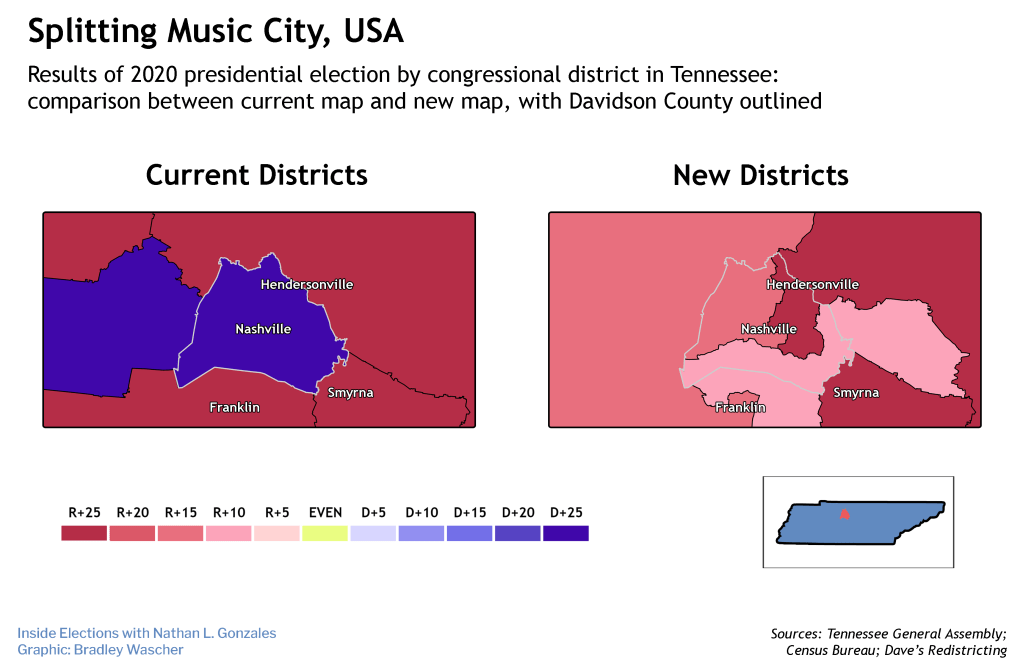
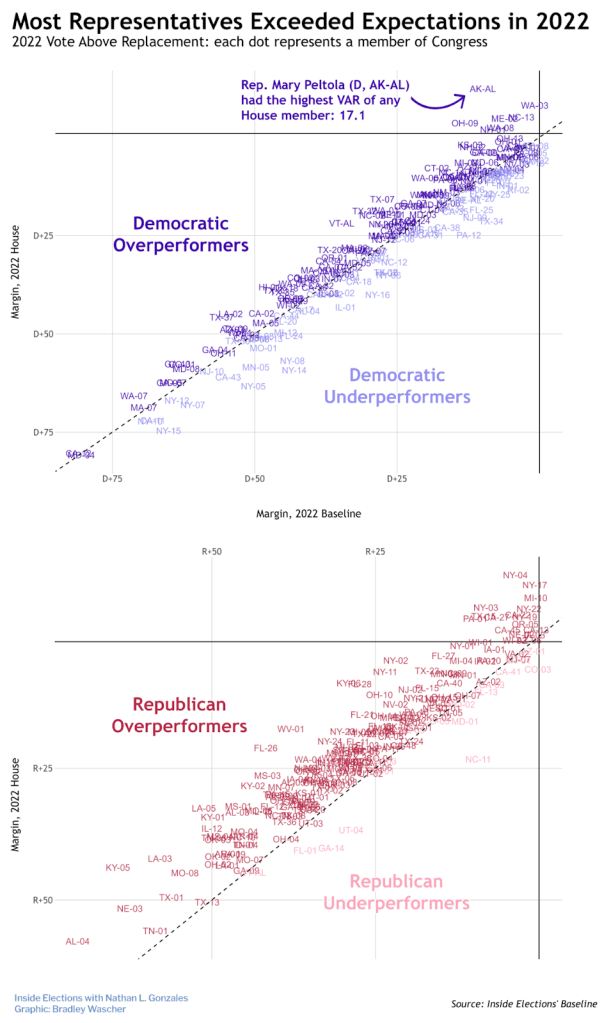
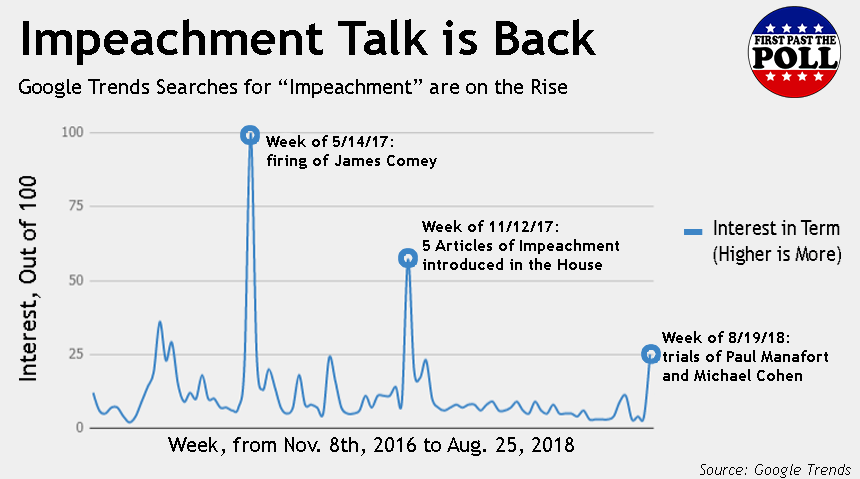
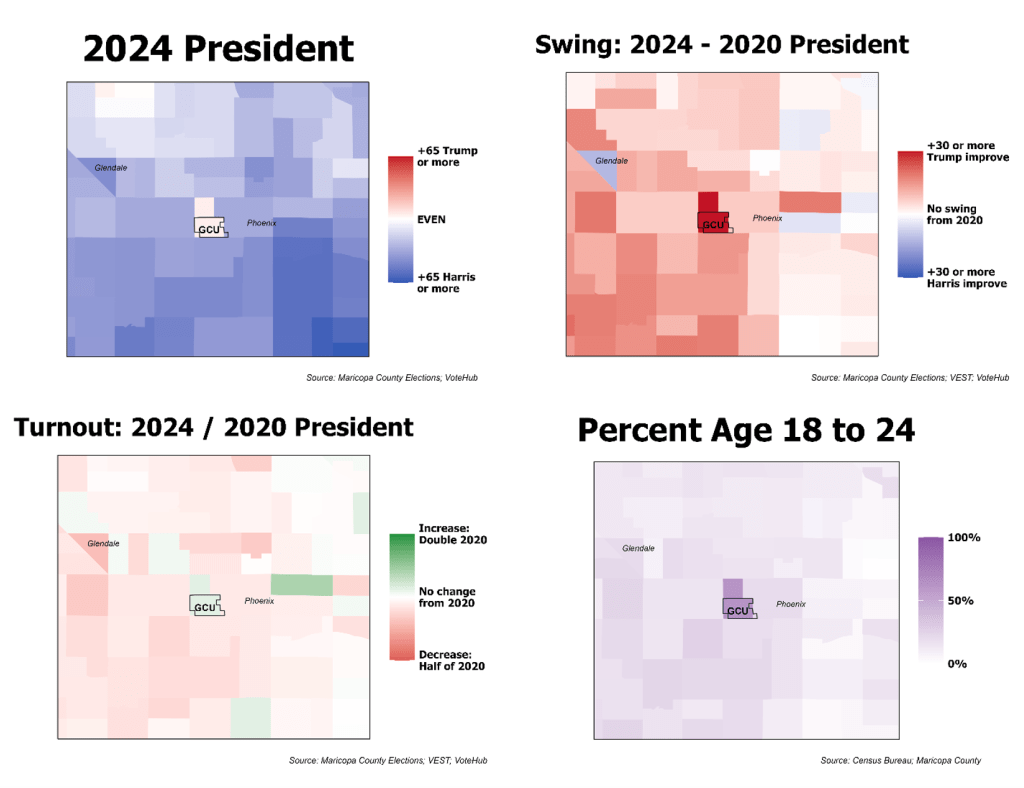
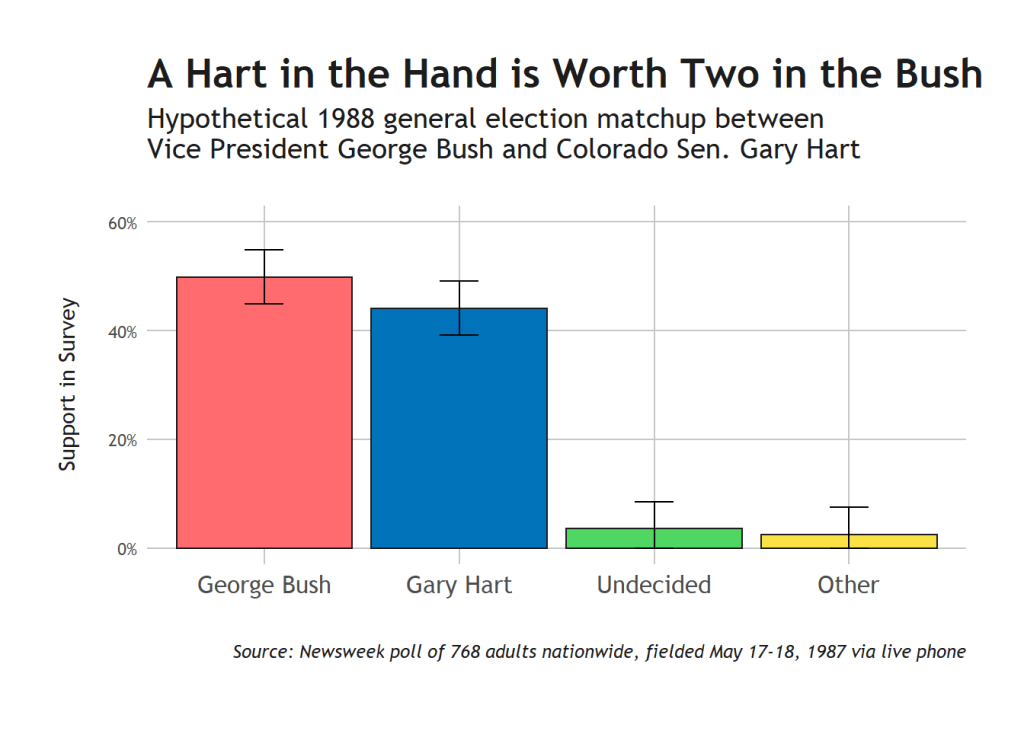
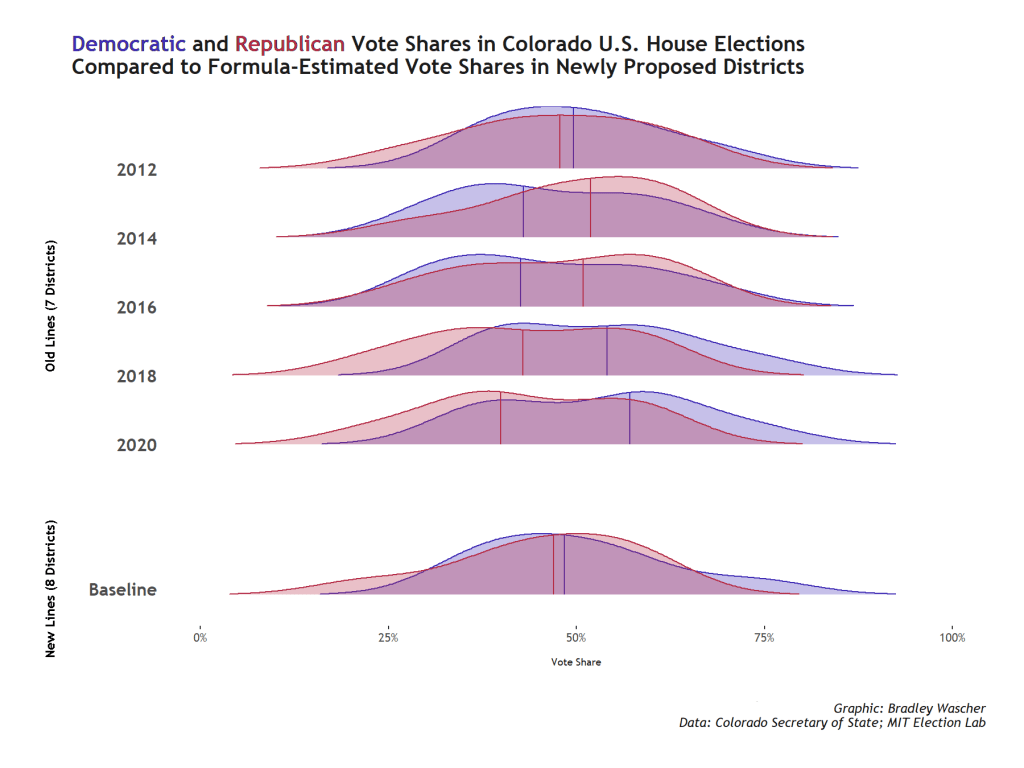
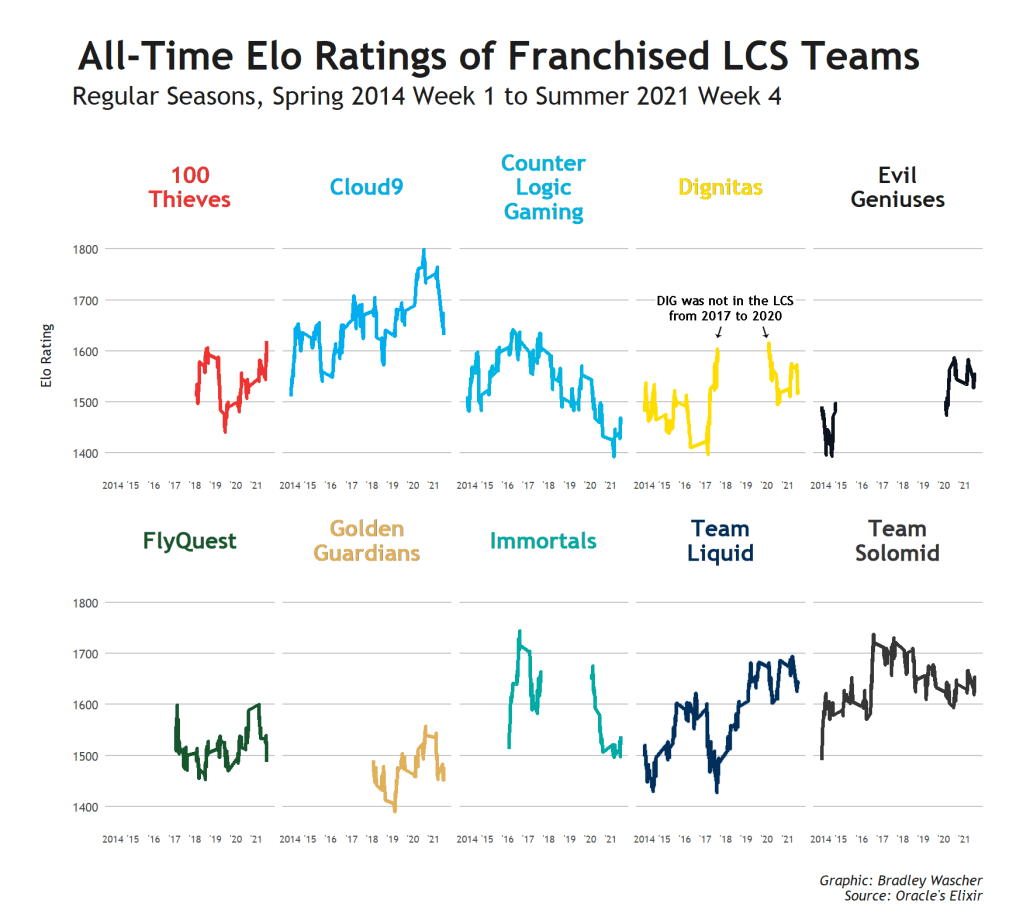
Map of election precincts in Wake County, NC, highlighting precincts that are narrowly split between the 2024 iterations of the 2nd and 13th congressional districts.Line graph comparing the buzz surrounding candidates following their presidential campaign announcements in 2008. Poor Evan Bayh. Blog post.Map illustrating the changes in Nashville following 2020 redistricting. The new lines crack Davidson County between three Republican-favored congressional districts, eliminating the solidly Democratic 5th District. Article.Dot plot showing the Vote Above Replacement (VAR) scores of all 2022 U.S. House winners. The average member was 2.2 points stronger than a typical candidate, and 78 percent earned a positive VAR. Article.Line graph tracking Google Trends search interest for the term “Impeachment” from November 8, 2016 (the date of Donald Trump’s election) to August 25th, 2018 (the publication date). Blog post.Choropleth maps showing election and demographic data in the precincts surrounding Grand Canyon University in Phoenix, Ariz. The heavily young precinct which contains the campus flipped 40 points toward Trump from 2020, with 13 percent higher turnout. Article.Bar chart of a May 1987 Newsweek poll which showed Vice President George Bush leading Colorado Sen. Gary Hart within the margin of error in a hypothetical general presidential election matchup. Data via The Roper Center. Ridgeline plot demonstrating how redistricting can partially serve to pull the average partisanship of a state’s districts back toward the center. Tweet.Line graphs charting the strength (via elo rating) of all ten major professional League of Legends esports teams in North America. The output comes from a model that I run as a hobby.